DOC024.98.93007
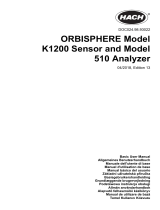
ORBISPHERE Model
3655 Portable Analyzer
03/2020, Edition 5
Basic User Manual
Basis-Benutzerhandbuch
Manuel d'utilisation simplifié
Manual básico del usuario
Основно ръководство за потребителя
Начальное руководство пользователя
Temel Kullanım Kılavuzu

Table of Contents
English..............................................................................................................................3
Deutsch.......................................................................................................................... 19
Français......................................................................................................................... 36
Español.......................................................................................................................... 53
български..................................................................................................................... 70
Русский..........................................................................................................................87
Türkçe...........................................................................................................................104
2

Table of Contents
1 Specifications on page 3
2 General information on page 3
3 Installation on page 5
4 User interface on page 7
5 Options setup on page 12
6 Calibration on page 14
7 Maintenance on page 16
8 Troubleshooting on page 17
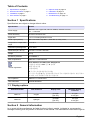
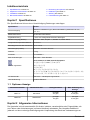
Section 1 Specifications
Specifications are subject to change without notice.
Specification Details
Power supply
Batteries: two C-type cells, NiCd or alkaline, each 26 x 50 mm,
2.4 - 3 volts total
Power autonomy 40 hours continuous use
Signal drift < 0.5% of reading between service
Serial output (RS232) Baud rate: 9600; Stop Bits: 1; Start Bits: 0; Parity: None;
Temperature compensation
range
-5 to 60°C
Instrument operating limits -5 to 100°C
Dimensions (H x W x D) 150 mm x 115 mm x 220 mm
Weight 2.4 kg
Enclosure protection IP 65/NEMA 4
EMC requirements EN61326-1: EMC Directive
Korean registration
User Guidance for EMC Class B Equipment
가정용을 포함하는 EMC 등급 B 장치에
대한 사용자 지침
사용자안내문
B 급 기기 ( 가정용 방송통신기자재 )
이 기기는 가정용 (B 급 ) 전자파적합기기로서 주로 가정에서 사용하는 것을 목적으
로 하며 , 모든 지역에서 사용 할 수 있습니다.
CE compliance EN61010-1: LVD Directive
ISO certification ISO9001/EN29001
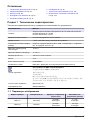
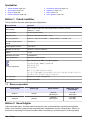
1.1 Display options
Instrument model Gas measured Display units Maximum display
resolution
3655/111 Oxygen
ppm/ppb
ppm only
0.1 ppb
0.001 ppm
3655/210 Hydrogen
ppm/ppb
ppm only
0.01 ppb
0.001 ppm
Section 2 General information
In no event will the manufacturer be liable for direct, indirect, special, incidental or consequential
damages resulting from any defect or omission in this manual. The manufacturer reserves the right to
English
3

make changes in this manual and the products it describes at any time, without notice or obligation.
Revised editions are found on the manufacturer’s website.
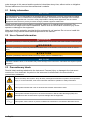
2.1 Safety information
N O T I C E
The manufacturer is not responsible for any damages due to misapplication or misuse of this product including,
without limitation, direct, incidental and consequential damages, and disclaims such damages to the full extent
permitted under applicable law. The user is solely responsible to identify critical application risks and install
appropriate mechanisms to protect processes during a possible equipment malfunction.
Please read this entire manual before unpacking, setting up or operating this equipment. Pay
attention to all danger and caution statements. Failure to do so could result in serious injury to the
operator or damage to the equipment.
Make sure that the protection provided by this equipment is not impaired. Do not use or install this
equipment in any manner other than that specified in this manual.
2.2 Use of hazard information
D A N G E R
Indicates a potentially or imminently hazardous situation which, if not avoided, will result in death or serious injury.
W A R N I N G
Indicates a potentially or imminently hazardous situation which, if not avoided, could result in death or serious
injury.
C A U T I O N
Indicates a potentially hazardous situation that may result in minor or moderate injury.
N O T I C E
Indicates a situation which, if not avoided, may cause damage to the instrument. Information that requires special
emphasis.
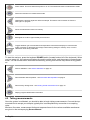
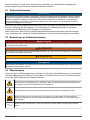
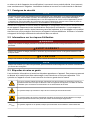
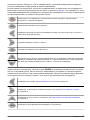
2.3 Precautionary labels
Read all labels and tags attached to the instrument. Personal injury or damage to the instrument
could occur if not observed. A symbol on the instrument is referenced in the manual with a
precautionary statement.
This is the safety alert symbol. Obey all safety messages that follow this symbol to avoid potential
injury. If on the instrument, refer to the instruction manual for operation or safety information.
This symbol indicates that a risk of electrical shock and/or electrocution exists.
This symbol indicates the presence of devices sensitive to Electro-static Discharge (ESD) and
indicates that care must be taken to prevent damage with the equipment.
This symbol, when noted on a product, indicates the instrument is connected to alternate current.
4 English

Electrical equipment marked with this symbol may not be disposed of in European domestic or
public disposal systems. Return old or end-of-life equipment to the manufacturer for disposal at no
charge to the user.
Products marked with this symbol indicates that the product contains toxic or hazardous substances
or elements. The number inside the symbol indicates the environmental protection use period in
years.
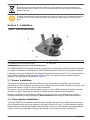
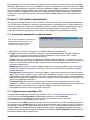
Section 3 Installation
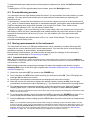
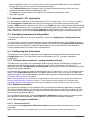
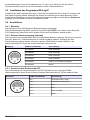
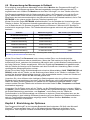
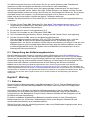
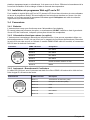
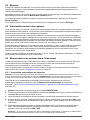
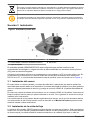
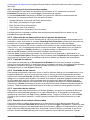
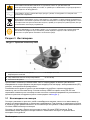
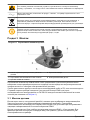
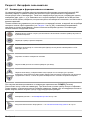
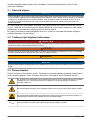
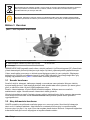
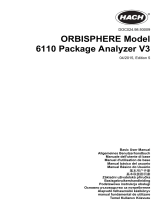
Figure 1 3655 Portable analyzer
1 Barometric pressure sensor relief valve 4 Flow chamber
2 RS232 port or external power supply 5 EC sensor
3 Battery cap
The ORBISPHERE 3655 portable analyzer is configured to make high-sensitivity dissolved hydrogen
or oxygen concentration measurements, with Electrochemical (EC) Sensors, for the power industry.
Locate the instrument convenient to the sample being analyzed and to the PC if one is being used. A
6-pin LEMO connector for RS-232 serial output to a PC, or an optional external power source is
located on the right side (as illustrated in Figure 1).
3.1 Sensor installation
The sensor has a threaded collar and calibration cap, and a screw-on protection cap to prevent
disturbances to the membrane. A plastic screw-on base at its rear provides a stand for servicing, and
protects the sensor's screw-on 10-pin LEMO connection.
The sensor connects to the instrument base through a 10-pin LEMO connector. A locking nut holds
the sensor in place. Generally, the sensor is shipped already installed in the instrument.
Shipping conditions can have adverse effects on the sensor, thus you should perform a sensor
service as described in the accompanying Sensor Manual before trying to make measurements.
3.2 Flow chamber installation
The model 32007D flow chamber draws the liquid sample past the sensor. It attaches to the sensor
with a threaded collar and is then sealed to the sensor with two O-rings. The flow chamber centrally
located inlet and eccentrically located outlet use either ¼-inch or 6-mm diameter transparent plastic
tubing. Connect by compression fittings to the sample source and to the drain, respectively.
English
5

3.3 WinLog97 PC program installation
Install the WinLog97 program onto the PC by inserting the accompanying CD into your PC and
running the SetUp program. Simply follow the on-screen instructions. When finished, a new Windows
Program Group labeled Orbisphere is created containing the software and help files.
3.4 Connections
3.4.1 Batteries
The instrument is designed to work on battery power.
If battery power should drop, a LO BAT warning appears in the instrument LCD's top-left corner, and
they should be replaced.
3.4.2 External power (optional)
The instrument is usually powered by the batteries supplied. You can, however, power it from an
external +5VDC source (as supplied by an electronics supply store). Connect the 2-wire output from
this source, using a model 28083 male 6-pin LEMO plug, to the RS-232 connector on the right side
of the instrument.
Connection LEMO-6 Pin Description
Pin 1 Not used
Pin 2 Not used
Pin 3 Not used
Pin 4 Not used
Pin 5 External +5VDC voltage input
Pin 6 Ground
3.4.3 Instrument - PC connection
An RS-232 cable is supplied with the instrument, with a 6-pin LEMO plug on one end and a 9-pin D-
Type plug on the other.
Connection LEMO-6 Pin Description
Pin 1 Transmitted data (TXD)
Pin 2 Received data (RXD)
Pin 3 CTS
Pin 4 RTS
Pin 5 Not used
Pin 6 Ground
6 English

Connection LEMO-6 Pin Description
Pin 1 Not used
Pin 2 RS-232 Transmitted Data (TXD)
Pin 3 RS-232 Received Data (RXD)
Pin 4 Not used
Pin 5 Ground
Pin 6 Not used
Pin 7 Request to send RTS
Pin 8 Clear to send RTS
Pin 9 Not used
Note: If you use an adapter for the connection to the PC, make sure it is designed for this purpose and, thus, has
all nine pins accessible. Some 25-to-9 pin adapters are supplied for specific use, such as a mouse, and these may
have only certain pins available.
It is not necessary to keep the PC connected to the instrument during measurement. This connection
is required for downloading stored measurements, real-time monitoring, reviewing and changing
configuration parameters and testing the instrument from the PC.
3.5 Installation checklist
3.5.1 Instrument clock setting
If you use the instrument to store measurements for downloading to a PC, you should verify the date
and time settings of the instrument's internal clock, as described in Clock settings on page 17.
3.5.2 Electrochemical sensor
Shipping conditions can have adverse effects on the sensor, thus you should perform a sensor
service as described in the accompanying Sensor Manual before trying to make measurements.
3.5.3 Flow chamber
The model 32007D flow chamber's inlet and outlet should be free of any obstructions.
3.6 Storage when not used
At the end of the workday, run clean water through the flow chamber to prevent passageways from
clogging. You may wish to repeat preconditioning (see Preconditioning sensors on page 9) prior
to the next use.
If you do not expect not to use your sensor for more than a few months, you should clean the sensor
as instructed in the Sensor Manual and then store it dry, without electrolyte, and with the calibration
cap in place for protection.
Section 4 User interface
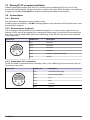
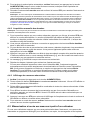
4.1 Keypad and function keys
The front panel of the instrument has a three-digit liquid crystal display (LCD). The LCD includes a
right-side marker to distinguish between gas concentration and temperature display. This marker
also indicates the measurement display units (ppm, ppb, etc.) depending on the instrument model.
To the LCD's right is a label showing the measurement units configured at the factory for your
application.
In addition to the controls indicated on the front panel, there is also a pressure relief valve switch on
top of the instrument (as indicated in Figure 1 on page 5) to enable atmospheric pressure equilibrium
for sensor calibration. The panel keyboard has the following push-button controls:
English
7

Power switch. This turns instrument power on or off. The instrument starts in measurement mode
Places the instrument in measurement mode
Calibrates the analyzer against a reference sample. This button can be locked out from the
WinLog97 PC program
Stores a measurement value into memory
Backlights the LCD for approximately three minutes
Toggles between gas concentration and temperature measurement displays in measurement
mode, increases or decreases the storage number during storage or memory view, or sets a
calibration value during calibration
To start the analyzer, press the keyboard POWER switch (located bottom left of the keyboard). When
you turn power on, the instrument displays its model number briefly, and then starts in measurement
mode. You can access other instrument functions by pushing one of these keys while turning power
on:
Sensor calibration - see
Sensor calibration on page 15
Start automatic data acquisition - see Automatic data acquisition on page 9
Start memory storage view - see Viewing stored measurements on page 10
Display program identification information
4.2 Taking measurements
Once the system is calibrated, you should be able to begin taking measurements. Connect the top-
mounted inlet to accept your sample, typically this is accomplished by connection to a sampling
valve.
Minimum flow rates, measurement limits and response times for the various available membranes
are given in the accompanying Sensor Manual.
8
English

To switch between gas measurement and temperature measurement, press the Up/Down Arrow
buttons.
To backlight the LCD for approximately three minutes, press the Backlight button.
4.3 Preconditioning sensors
You can expect a more rapid and accurate first result if you precondition the sensor before you take
readings. You may want to precondition prior to each series of measurements, depending on
frequency of use.
To precondition, connect the flow chamber to a convenient sampling source at or below expected O
2
or H
2
levels. If measurements take place in carbonated samples, precondition with carbonated water.
Open the sampling valve on the flow chamber, just enough for a trickle. Then, switch on the
instrument and watch the LCD. You will see the values drop.
Typically for oxygen, if you are measuring in the 0.1 ppm range, then only a short time is required for
the display to fall to this level, whereas ppb level measurements may require the sensor to remain
exposed to the sample for half an hour or more. You will establish your own requirement with
experience.
Once the LCD displays the expected level of O
2
or H
2
, close off the sample. The sensor is now
preconditioned and ready to use.
4.4 Storing measurements in the instrument
The instrument will store up to 500 gas measurement values, labeled by numbers 0 through 499,
along with the current date and time of each measurement. You have the choice of acquiring this
information manually or automatically, as described below.
Before storing measurements, you should verify the date and time settings of the instrument's
internal clock, as described in Clock settings on page 17.
4.4.1 Automatic data acquisition
Note: When the instrument is used to automatically store measurement data, all buttons except the POWER key
are disabled. If enough time elapses to store all 500 values, the instrument will return to normal measurement mode
and the buttons re-enabled.
Before starting automatic measurement storage, first select the sampling rate desired using the
Sampling Rate menu of the WinLog97 program (see Automatic data acquisition - setting sampling
intervals on page 13).
1. Switch the instrument OFF (by pressing the POWER key).
2. Then hold down the STO button while switching the instrument back ON. The LCD displays the
message Sto for about one second.
3. Normal gas concentration measurements are displayed for about two minutes.
4. After two minutes the instrument displays the sample number (starting at 000), then the gas
concentration measurement value followed by [- - -] to indicate the measurement is being stored.
5. This storage sequence repeats automatically, at the rate specified by the WinLog97 program
Sampling Rate menu. Values are stored sequentially in sample numbers 000 through 499.
Note: If you have not cleared previously stored values, the storage sequence automatically overwrites the older
values, as they are stored.
6. To end automatic storage, switch the instrument OFF (by pressing the POWER key) while it is in
normal measurement mode and not while it is in the process of automatically storing data.
7. Switching ON again without holding down the STO button returns the instrument to measurement
mode.
Note: If you accidentally interrupt the automatic data storage by switching off the instrument while it is in the
process of storing a value, and you then attempt to download the stored values by the WinLog97 program, you
will get a Windows Checksum Error message, and you will not be able to view the measurement data. If this
happens, then go back to the instrument and manually log one more value (as described in Manual data
acquisition on page 10). You can then download your original set of values to your PC.
English
9

4.4.2 Manual data acquisition
Note: You cannot store measurement data manually if the instrument has already been set up to store the data
automatically.
1. For the first measurement you wish to store, press the STO button once to display a sample
number. The default sample number is 000 (for first time access), or the last used memory
position where data was stored, incremented by a value of 1.
2. You can increase or decrease this number by pressing the Up/Down Arrow buttons within three
seconds.
3. Should you decide at this point, not to store this particular measurement, just wait five seconds
and the display returns to measurement mode. You may also exit this routine by pressing the
MEAS button.
4. Press STO a second time, within five seconds of the first. The instrument then displays a brief
clearing [- - -] message, followed by the gas concentration measurement value for about three
seconds
5. The [- - -] message is displayed as this measurement value is stored
6. Repeat the above steps to store additional measurements.
If you stored the first value as sample 001, the instrument automatically increases the next
storage location, and labels it sample 002. You can increase or decrease this number by pressing
the Up/Down Arrow buttons. If you label a sample number the same as a previously stored
measurement value, the new measurement value overwrites the previously stored value.
4.4.3 Viewing stored measurements
1. Switch the instrument OFF (by pressing the POWER key).
2. Hold down the Up Arrow button while switching the instrument back ON. The LCD displays a
sample location number.
3. Scroll through the numbered sample locations of all the stored values using the Up Arrow and
Down Arrow buttons.
4. To view the actual gas concentration measurement value at a particular sample number, press
the STO button. The LCD now displays the stored value for that sample number.
5. Press STO a second time to return to the next numbered location display, to continue scrolling or
view another stored value.
6. To return to the measurement mode, switch the instrument OFF and then back ON again without
holding down any additional buttons.
4.5 Storing and accessing measurements from the PC
If you have made measurements and stored them in the instrument, you should be ready to bring
them into the WinLog97 program for viewing, copying, saving and printing. See also Options setup
on page 12 for additional information on the WinLog97 program.
4.5.1 Downloading stored values
To download the stored results from the instrument to the PC, choose the DownLoad data command
from the Logger menu.
The DownLoad window presents a display of the stored measurements from the instrument. The
window displays five columns of data:
• Sample (sequence number of the sample)
• Gas (concentration of the measured gas)
• Date (date of the measurement)
• Time (time of the measurement)
• Sample Description
The descriptions can be modified for your applications using the procedures described below.
10
English

4.5.2 Altering the sampling point descriptions
For help in identifying the locations of various sampling points that are stored by the instrument, you
may choose the Sampling Point Description command from the Logger menu to bring up the
dialog box.
The measurement values to be placed in positions 0 through 499 (identified as Text 0, Text 1... etc.)
can be described however you wish. Double-click on a particular position (or click Modify), then type
a description in the box. Choose OK when finished entering a description.
When you Close this box, your modifications will be saved, and will appear in the Sample
Description column for the next downloaded list. These descriptions can be modified again later as
your requirements change.
4.5.3 Copying values
To copy the results to the Windows Clipboard, so that the data can be pasted into a spreadsheet,
word processor or other Windows program that accepts tabular text information, choose the
Clipboard command from the Export menu.
4.5.4 Saving values
To save this list of measurements as a text (.txt) file, capable of being recalled by the
WinLog97 program or imported as a file into other Windows programs, choose the Save As
command from the File menu. A dialog box appears, with a space to fill in with an eight-letter name.
(The program automatically attaches a .txt suffix to these files.) If you have saved previous files, a
grayed-out list of these names appears as well. Typical to Windows programs, Directories and
Drives boxes can be used to locate other places to save. You may also type the drive and directory
yourself when saving the file.
4.5.5 Printing values
To place this list of measurements into a tabular format and send it to the Windows printer, choose
the Print command from the File menu. The program asks you to enter Title and Author
information. Note that the Date is fixed by your operating system. The resulting printed list will
include this information on each page.
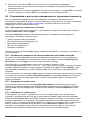
4.5.6 Clearing stored values
To clear all the values stored in the instrument via the WinLog97 program, choose the Clear Data
command from the Logger menu. Since this action will clear the storage memory of the instrument, a
warning appears first. Choose OK to bring up the next dialog box to confirm the clear action. Choose
Clear to start the memory clear operation. A message, Reset should be completed appears in this
box when the task is finished.
Note: You can accomplish the same thing passively, by simply allowing the analyzer to overwrite a set of stored
values with new ones.
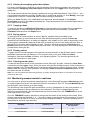
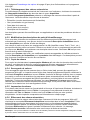
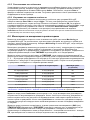
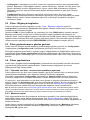
4.6 Monitoring measurements in real-time
You may wish to analyze a particular sampling point via the WinLog97 program's Monitoring menu.
To use this Monitoring chart, the instrument must be connected to your PC. Choose Monitoring from
the WinLog97 menu to bring up a chart display.
The Monitoring chart shows the gas concentration (in blue), temperature (in red), and pressure (in
green) as the sample is being measured by the instrument. The chart is updated directly from
instrument measurements, at a rate determined by the time scale set in the TIMEBASE box at the
lower right corner of the chart.
Click the TIMEBASE up/down pointers to change the time scale of the divisions of the chart. Each
division mark along the baseline (1, 2, ...10) can be made to represent from 30 seconds to 2½ hours,
providing from 5 minutes to 25 hours of continuously displayed samples. The chart updating rate is
determined by the time scale selected.
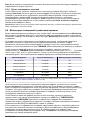
Timebase Updating rate* Maximum samples
(10 divisions)
30 Seconds/Division 5 Seconds/Sample 60
1 Minute/Division 5 Seconds/Sample 120
English 11

Timebase Updating rate* Maximum samples
(10 divisions)
10 Minutes/Division 5 Seconds/Sample 1,200
30 Minutes/Division 9 Seconds/Sample 2,000
1 Hour/Division 18 Seconds/Sample 2,000
2.5 Hours/Division 45 Seconds/Sample 2,000
*This chart's updating rate is independent from the acquisition rate (see Automatic data acquisition - setting
sampling intervals on page 13).
Click on the Continuous box, in the lower right corner, to enable or disable continuous charting.
When this box is checked, the chart scrolls continuously after reaching the 10 division, and the oldest
samples are lost off the left of the chart. When Continuous is not checked, the chart stops displaying
new results after reaching the 10 division, and all subsequent measurements are lost.
Click the up/down pointers for each measurement variable (GAS, TEMPERATURE and
PRESSURE) at the right of the chart to change the scaling of that value on the chart. The display of
each measurement variable may be turned on or off by choosing the appropriate On or Off switch at
the right of the chart.
If your measurements do not chart properly, try using a higher or lower value scale or time base than
the one displayed. Adjust these scale factors before starting the monitoring operation. A running
display of latest sample Gas, Temperature and Pressure is also shown in the bottom-right corner of
the chart.
Use the buttons at the bottom of the chart to control real-time monitoring. Choose Go to clear the
chart and start real-time monitoring display, Stop to stop real-time monitoring and Copy to copy the
data from the chart as text information to the Windows Clipboard. This information can be pasted
from the clipboard into any Windows application, such as a spreadsheet or word processor. Finally,
choose Close to close the Monitoring window.
Section 5 Options setup
The WinLog97 program is an integral part of the analyzer. Running under Microsoft Windows
®
, it
permits you to list and analyze up to 500 stored measurement values. The program also includes a
special monitoring feature, which lets your computer act as a chart recorder, and enables a hardware
test to ensure that the system is in good working order.
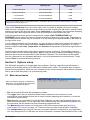
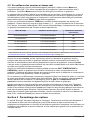
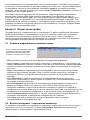
5.1 Main menu basics
When you start the program, it displays the
Main Menu, which automatically maximizes
on opening and appears as follows:
•
File serves typical Windows file management needs.
• The Logger menu lets you download measurement values from the instrument, make
modifications to the sample list that can be used to identify sampling point locations, or clear the
instrument's stored values.
• Export places your information into the Windows Clipboard, so that it can be pasted directly into
other Windows programs. This is especially useful when working with spreadsheet programs, but
the information can be pasted into word processing programs as well.
• The Monitoring menu creates a running chart of real-time measurements (see Monitoring
measurements in real-time on page 11). These can also be saved to the Windows Clipboard.
• The Configuration menu lets you see how your system has been configured for your application.
You may change the PC's COM port, the sensor membrane, automatic data acquisition rate, or the
12
English

sensor calibration mode. You may also lock out the instrument's CAL button, or for calibration
using a span gas, you may enter the span gas percentage.
• The Troubleshooting menu includes a series of tests, permits the setting of the clock, and
enables a barometric pressure calibration routine.
• The Help menu gives access to the Help file and allows the identification of the
WinLog97 program.
5.2 Instrument - PC connection
For the hardware connection of the instrument to a PC, see Instrument - PC connection on page 6.
The Configuration, Serial port menu lets you choose one of four serial communication ports.
Usually, COM1 is used to connect to a mouse, so try COM2 first. You may find that a separate SetUp
program supplied with your PC is necessary to activate this port. Click on OK to activate the selected
port. If the port you have selected here is adequate, the WinLog97 program will return to the main
menu. Otherwise, you will see an RS232 ERRORS message advising you to select another port.
5.3 Reviewing instrument configuration
To review if the analyzer is set up as expected, choose the Configuration, Configuration view
command.
You may change a number of these settings using the WinLog97 program. The modifiable settings,
and information relating to these settings are listed in the next section, Configuring the instrument.
However, should you see any unexpected items listed on your screen which you are unable to
correct, please contact your Hach Lange representative.
5.4 Configuring the instrument
The analyzer can be readily configured for your application using the following commands in the
Configuration menu. The instrument must be connected to your PC in order to change its
configuration.
5.4.1 Automatic data acquisition - setting sampling intervals
The instrument can perform as a standalone data acquisition device, automatically recording gas
measurements with the date and time, and storing up to 500 of these values. Choosing the
WinLog97 program's Configuration, Sampling Rate menu lets you select time intervals (acquisition
rate) for this storage capability.
Use the slide bar to view and select a sampling rate, from 15 seconds to 1 hour. The selected rate is
shown in the Acquisition rate window. Click OK to save this rate. Once your choice is made, the
instrument can be used independently of the WinLog97 program for data acquisition, as described in
Automatic data acquisition on page 9.
Note: The Acquisition rate set via this menu is independent from the monitoring chart updating rate described in
Monitoring measurements in real-time on page 11. The sampling rate menu applies only to automatic data
acquisition, while the chart updating rate is used only for displaying real-time results via the monitoring chart.
5.4.2 Membrane selection
You may find it necessary to use a different type of membrane for different applications. Naturally,
with any membrane change, you will need to re-calibrate (see Sensor calibration on page 15). You
should also consider the changes in required flow rates and response times, which are specified in
the accompanying Sensor Manual.
To re-configure the analyzer, choose Configuration, Membrane to bring up the box which reveals
the membrane models available. Choose OK when the desired membrane is selected.
5.4.3 Selecting type of calibration
5.4.3.1 Select from the PC
You can use the Configuration, Calibration mode command to select how the sensor is to be
calibrated.
Note: Only the calibration modes applicable to your sensor can be selected. Others will be grayed out.
English
13

Choose In Air to allow calibration of the sensor in air (only applicable to Oxygen sensors). Choose In
Line to calibrate the sensor directly in the sampling line, in a sample of known gas content or select
In a Span Gas to calibrate in a source of gas of known oxygen or hydrogen concentration. Choose
OK when the desired mode is selected.
5.4.3.2 Select from the instrument
1. Switch the instrument power OFF
2. Switch the instrument on by holding down the CAL button and then pressing the POWER button
while still pressing the CAL button
3. The instrument display will show either SPA for span gas calibration, LI for in line calibration, or
Air for in air calibration
4. Use the Up/Down Arrow buttons to change the mode to your choice
5. Press the STO button to set the selected mode. The instrument displays Sto for a few seconds,
then returns to measurement mode
5.4.4 Locking out the instrument's CAL button
You can use the Configuration, Calibration Key Status menu to prevent an accidental sensor re-
calibration from the instrument keyboard.
Choose Disabled to lock out the keyboard CAL button. To unlock this capability, choose Enabled.
Choose OK when the desired mode is selected.
5.4.5 Sensor calibration range checking
When calibration is performed for In Air and In a Span Gas calibration modes, the sensor
measurement current is compared to an ideal current for the selected membrane to determine
whether or not to complete the calibration. You can use the Configuration, Calibration Range
Checking menu to enable or disable sensor calibration range checking in the instrument.
Choose Disabled to calibrate without checking the value of the measurement current, within a range
of 0% to 999% of the ideal current.
When set to Enabled, at calibration the measurement current should be between 25% and 175% of
the ideal current; if the value is outside of these limits, the calibration fails and Err is displayed on the
instrument LCD. Choose OK when the desired mode is selected.
Note: It is recommended to leave range checking enabled. In special measurement situations it may be necessary
to disable range checking. However, contact a Hach Lange representative for further details before disabling this
feature.
5.4.6 Entering a span gas value
When calibrating the sensor in a span gas, use the Configuration, Span Gas menu to enter the
concentration of the gas to be measured in the span gas. Enter the percentage of measurement gas
in the span gas (e.g. 10.00%), then choose OK.
Section 6 Calibration
6.1 Pressure calibration
Since the instrument is sealed against moisture, you must open the barometric pressure sensor relief
valve switch on top of the instrument (see Figure 1 on page 5 for actual location) to permit the
instrument to achieve atmospheric pressure equilibrium, and take an accurate barometric pressure
reading.
This must be done with every calibration. To open the relief valve, depress and hold down the
pressure sensor relief valve switch for five seconds, then release.
If you have access to an accurate barometer, you may wish to calibrate the instrument's internal
barometric pressure sensor. This is done using the PC WinLog97 program. Choose
Troubleshooting, Pressure Calibration and an informational message will appear to warn you that
the instrument’s current pressure calibration will be lost.
14
English

Choose OK to continue. The calibration procedure then displays a Pressure Calibration dialog box.
The Measured Pressure value shows the current instrument pressure reading.
Note: Since the instrument is sealed against moisture, you must open the barometric pressure sensor relief valve
switch (location depicted in Figure 1 on page 5) to permit the instrument to achieve atmospheric pressure
equilibrium, and take an accurate barometric pressure reading.
Enter the current atmospheric pressure, in mbars, in the Calibration Pressure entry box. Choose
Calibrate to direct the instrument to read and display the Measured Pressure using this calibration
value. Choose Quit when you are satisfied with the pressure calibration to return to normal
operation.
6.2 Sensor calibration
When delivered, the sensor is pre-calibrated. However, it should be re-calibrated on site, when being
used for the first time, and always after a membrane change. If you have just replaced the
membrane, allow at least half an hour for the membrane to settle before attempting to calibrate.
If you want to verify the accuracy of the calibration, place the analyzer back in measurement mode
and compare your displayed gas concentration against the value in the appropriate tables found in
the accompanying Calibration Tables booklet.
Your calibration is stored internally and is valid for the life of the sensor's membrane, thus it is not
necessary to repeat the calibration procedure until after the next membrane change.
The sensor can be calibrated either by using a span gas, directly in line in a liquid sample, or in air.
The mode of calibration may be selected using the WinLog97 program or directly from the instrument
(see Selecting type of calibration on page 13 for more details).
6.2.1 Calibration in span gas
The span gas calibration procedure may be used if you have a supply of gas with a known
concentration in % units (use O
2
for oxygen sensors or H
2
for hydrogen sensors). To perform this
type of calibration, the instrument must be set for calibration In a Span Gas. The WinLog97 program
also must be used in this procedure.
Switch on the instrument, if necessary, and wait a minute or so for the displayed measurement to
settle. Then expose the sensor to a span gas sample with a known gas concentration. Enter the
percentage of gas in the span gas using the WinLog97 program (see Entering a span gas value
on page 14).
1. Press the CAL button. Remember, this button may have been locked out to prevent an accidental
reset (see Locking out the instrument's CAL button on page 14 for details).
2. A brief clearing [- - -] message appears.
3. Press CAL again within a 3 second period.
4. The percentage of the measured current to the ideal one is displayed.
5. When the reading is stable, press CAL again.
If the new calibration current is within 25% to 175% of the ideal current, the instrument displays
CAL and returns to the measurement mode. Calibration is now complete, the sensor is
calibrated, and you can proceed with your measurements. If the new calibration current is not
within this range, the instrument displays Err and returns to measurement mode. The system will
not calibrate, and it is likely that a sensor service will be required.
6.2.2 Calibration in line
The in line calibration procedure can be used to calibrate the sensor directly in line, against a liquid
sample with a known dissolved gas concentration. To perform this type of calibration, the instrument
must be set for calibration In line. Switch on the instrument, if necessary, and wait a minute or so for
the displayed measurement to settle. Expose the sensor to a liquid sample with a known gas
concentration.
1. Press the CAL button. Remember, this button may have been locked out to prevent an accidental
reset (see Locking out the instrument's CAL button on page 14 for details).
2. A brief clearing [- - -] message appears.
English
15

3. Press CAL again within a 3 second period.
4. A measurement will flash on the LCD, showing the gas concentration of the calibration sample.
5. Assuming you know the gas content to be a certain value, you can adjust the displayed value with
the Up/Down Arrow keys.
6. When the reading is adjusted to the known concentration, press CAL again.
7. The instrument displays CAL and returns to the measurement mode.
6.2.3 Calibration in air (oxygen sensors only)
The oxygen sensor can be accurately calibrated in air. To perform this type of calibration, the
instrument must be set for calibration In air.
In order to calibrate the sensor in air, you will need to extract it from its mounting or flow chamber,
and wipe dry the sensor protection grille (if applicable).
Calibration is best achieved using the storage cap that protected the sensor during shipment. Put
several drops of tap water in the cap, shake out the excess, and then attach it to the sensor by
means of its collar. It is best to leave the cap slightly loose, to avoid compressing the air inside. The
cap and sensor should be about the same temperature.
Switch on the instrument, if necessary, and wait a minute or so for the displayed measurement to
settle.
1. Press the CAL button. Remember, this button may have been locked out to prevent an accidental
reset (see Locking out the instrument's CAL button on page 14 for details).
2. A brief clearing [- - -] message appears.
3. Press CAL again within a 3 second period.
4. The percentage of the measured current to the ideal one is displayed.
5. When the reading is stable, press CAL again.
If the new calibration current is within 25% to 175% of the ideal current, the instrument displays
CAL and returns to the measurement mode. Calibration is now complete, the sensor is
calibrated, and you can proceed with your measurements. If the new calibration current is not
within this range, the instrument displays Err and returns to measurement mode. The system will
not calibrate, and it is likely that a sensor service will be required.
6.3 Calibration range checking
When calibrating the sensor in air or in a span gas, as detailed in Sensor calibration on page 15, the
new calibration current should be between 25% to 175% of the ideal current (which is stored in the
instrument's non-volatile memory for each membrane). If not, the instrument displays Err on its LCD
and the system will not calibrate. When the system will not calibrate, it is likely that a sensor service
will be required.
Note: This calibration range checking can be enabled or disabled using the WinLog97 program (see Sensor
calibration range checking on page 14). It is recommended to leave this checking feature enabled. In special
measurement situations it may be necessary to disable range checking. This will allow calibration between 0% to
999% of the ideal current. Contact a Hach Lange representative before disabling this range checking feature.
Section 7 Maintenance
7.1 Instrument batteries
The instrument operates on battery power (two standard C-type cells). If battery power should drop,
a LO BAT warning message appears in the instrument LCD's top-left corner.
To install the batteries, unscrew the battery cap (on the right side of the instrument) with a coin or flat
screwdriver, place the cells lengthwise into the battery compartment (positive end first), and then
replace the cap. Refer to the diagram on the back of the instrument.
Rechargeable nickel-cadmium batteries may be used - expect about 40 hours of autonomy. Alkaline
batteries provide the longest continuous use though mercury-free batteries are available that present
less of a disposal problem.
16
English

Make sure that a fully charged (or fresh) set is installed before switching on the instrument.
7.2 Sensor
For information on sensor maintenance and servicing, please refer to the accompanying Sensor
Manual.
Section 8 Troubleshooting
If your analyzer is behaving strangely (failing to calibrate, giving inappropriate measurement values,
etc.) and you have attempted to rectify the problem by servicing the sensor, but to no avail, you may
wish to use the Troubleshooting menu of the PC WinLog97 program to make sure that the
instrument is configured correctly for your application, and is in good working order.
The instrument must be connected to your PC and placed in measurement mode to perform these
tests.
8.1 Serial test
Normally, the analyzer will inform you of a disconnected RS-232 (serial) link when appropriate.
However, you can confirm a good connection using the Troubleshooting, Serial Link Test by
echoing a test message via the instrument.
Enter text characters in the Text to be sent box, then click Send. If the serial link is operating
correctly, the exact same text will be displayed back from the instrument in the Echo box. Choose
Cancel to exit from this test box.
8.2 Keyboard test
The Troubleshooting, Keyboard Test will reveal whether all the analyzer buttons are functioning
correctly.
Press any one of the instrument's buttons (except the ON/OFF button) for a full second or more. The
appropriate square on-screen should darken. Choose Cancel to exit from this test box.
8.3 Display test
Choosing Troubleshooting, Display Test lets you perform a one-way communication between
computer and instrument.
Type a number in the Number box (you may also select one of three units positions for the LCD's
rightmost indicator bar as well). Then choose Send. The number and indicator bar placement should
appear on your instrument LCD.
8.4 Clock settings
Choose the Clock settings command to set the date and time in the instrument.
The first screen displays the current date and time as set in the instrument. If this is correct, choose
Ok, else if either date or time must be changed, choose Modify to bring up the next screen. Enter
the current date and time and choose Ok to store the entry into the instrument. All measurements will
be noted with the appropriate date and time when they are downloaded to the WinLog97 program.
8.5 Analog voltages view
The Troubleshooting, Analog Voltage View gives a real-time look at voltages used by the system
to transmit information about sensor current, temperature and pressure. This is useful when trying to
identify an instrument problem with a Hach Lange service representative either on-site or over the
phone.
When performing this test, if the system is over-range, you may receive a message that states, for
example, The current input is saturated. Similar messages will also appear, to warn when
temperature and pressure limits are exceeded.
The voltage limits for normal operation are:
English
17

• Current channel: -1.5 V to +1.5 V
• Temperature channel: +10 mV to +4 V
• Pressure channel: -100 mV to +100 mV
The Range window on the right side of the Current channel voltage indicates one of the four
instrument ranges: 0 (less sensitive) to 3 (most sensitive).
8.6 Measurements view
The Troubleshooting, Measurements View confirms, on your PC monitor, what your instrument
should be displaying on the LCD for gas concentration and sample temperature. Choose Cancel to
exit from this display.
18 English

Inhaltsverzeichnis
1 Spezifikationen auf Seite 19
2 Allgemeine Informationen auf Seite 19
3 Installation auf Seite 21
4 Benutzeroberfläche auf Seite 23
5 Einrichtung der Optionen auf Seite 28
6 Kalibrierung auf Seite 31
7 Wartung auf Seite 33
8 Fehlerbehebung auf Seite 34
Kapitel 1 Spezifikationen
Die Spezifikationen können ohne Vorankündigung Änderungen unterliegen.
Spezifikation Details
Stromversorgung
Batterien: 2 Batterien Typ C, NiCd oder Alkaline, jeweils 26 x 50 mm,
2,4 - 3 V
Batterieautonomie 40 Stunden Dauerbetrieb
Signalabweichung < 0,5% der Anzeigeskala zwischen Wartungen
Serieller Ausgang (RS232) Baudrate: 9600; Stopbits: 1; Startbits: 0; Parität: Keine;
Temperaturkompensationsbereich
-5 bis 60℃
Betriebsgrenzwerte des Instruments -5 bis 100°C
Abmessungen (HxBxT) 150 mm x 115 mm x 220 mm
Gewicht 2,4 kg
Schutzart IP 65/NEMA 4
EMV-Anforderungen EN61326-1: EMV-Richtlinie
Korean registration
User Guidance for EMC Class B Equipment
가정용을 포함하는 EMC 등급 B 장치에
대한 사용자 지침
사용자안내문
B 급 기기 ( 가정용 방송통신기자재 )
이 기기는 가정용 (B 급 ) 전자파적합기기로서 주로 가정에서 사용하는 것을
목적으로 하며 , 모든 지역에서 사용 할 수 있습니다.
CE-Konformität EN61010-1: Niederspannungsrichtlinie
ISO-Zertifizierung ISO9001/EN29001
1.1 Optionen Anzeige
Instrumentenmodell Gemessenes Gas Anzeigeeinheiten Max. Auflösung der
Anzeige
3655/111 Sauerstoff
ppm/ppb
nur ppm
0,1 ppb
0,001 ppm
3655/210 Wasserstoff
ppm/ppb
nur ppm
0,01 ppb
0,001 ppm
Kapitel 2 Allgemeine Informationen
Der Hersteller ist nicht verantwortlich für direkte, indirekte, versehentliche oder Folgeschäden, die
aus Fehlern oder Unterlassungen in diesem Handbuch entstanden. Der Hersteller behält sich
jederzeit und ohne vorherige Ankündigung oder Verpflichtung das Recht auf Verbesserungen an
Deutsch
19

diesem Handbuch und den hierin beschriebenen Produkten vor. Überarbeitete Ausgaben der
Bedienungsanleitung sind auf der Hersteller-Webseite erhältlich.
2.1 Sicherheitshinweise
H I N W E I S
Der Hersteller ist nicht für Schäden verantwortlich, die durch Fehlanwendung oder Missbrauch dieses Produkts
entstehen, einschließlich, aber ohne Beschränkung auf direkte, zufällige oder Folgeschäden, und lehnt jegliche
Haftung im gesetzlich zulässigen Umfang ab. Der Benutzer ist selbst dafür verantwortlich, schwerwiegende
Anwendungsrisiken zu erkennen und erforderliche Maßnahmen durchzuführen, um die Prozesse im Fall von
möglichen Gerätefehlern zu schützen.
Bitte lesen Sie dieses Handbuch komplett durch, bevor Sie dieses Gerät auspacken, aufstellen oder
bedienen. Beachten Sie alle Gefahren- und Warnhinweise. Nichtbeachtung kann zu schweren
Verletzungen des Bedieners oder Schäden am Gerät führen.
Stellen Sie sicher, dass die durch dieses Messgerät bereitgestellte Sicherheit nicht beeinträchtigt
wird. Verwenden bzw. installieren Sie das Messsystem nur wie in diesem Handbuch beschrieben.
2.2 Bedeutung von Gefahrenhinweisen
G E F A H R
Kennzeichnet eine mögliche oder drohende Gefahrensituation, die, wenn sie nicht vermieden wird, zum Tod oder
zu schweren Verletzungen führt.
W A R N U N G
Kennzeichnet eine mögliche oder drohende Gefahrensituation, die, wenn sie nicht vermieden wird, zum Tod oder
zu schweren Verletzungen führen kann.
V O R S I C H T
Kennzeichnet eine mögliche Gefahrensituation, die zu leichteren Verletzungen führen kann.
H I N W E I S
Kennzeichnet eine Situation, die, wenn sie nicht vermieden wird, das Gerät beschädigen kann. Informationen, die
besonders beachtet werden müssen.
2.3 Warnhinweise
Lesen Sie alle am Gerät angebrachten Aufkleber und Hinweise. Nichtbeachtung kann Verletzungen
oder Beschädigungen des Geräts zur Folge haben. Im Handbuch wird in Form von Warnhinweisen
auf die am Gerät angebrachten Symbole verwiesen.
Dies ist das Sicherheits-Warnsymbol. Befolgen Sie alle Sicherheitshinweise im Zusammenhang mit
diesem Symbol, um Verletzungen zu vermeiden. Wenn es am Gerät angebracht ist, beachten Sie
die Betriebs- oder Sicherheitsinformationen im Handbuch.
Dieses Symbol weist auf die Gefahr eines elektrischen Schlages hin, der tödlich sein kann.
Dieses Symbol zeigt das Vorhandensein von Geräten an, die empfindlich auf elektrostatische
Entladung reagieren. Es müssen Vorsichtsmaßnahmen getroffen werden, um die Geräte nicht zu
beschädigen.
Dieses Symbol weist darauf hin, dass das Instrument an Wechselstrom angeschlossen werden
muss.
20 Deutsch
Sayfa yükleniyor...
Sayfa yükleniyor...
Sayfa yükleniyor...
Sayfa yükleniyor...
Sayfa yükleniyor...
Sayfa yükleniyor...
Sayfa yükleniyor...
Sayfa yükleniyor...
Sayfa yükleniyor...
Sayfa yükleniyor...
Sayfa yükleniyor...
Sayfa yükleniyor...
Sayfa yükleniyor...
Sayfa yükleniyor...
Sayfa yükleniyor...
Sayfa yükleniyor...
Sayfa yükleniyor...
Sayfa yükleniyor...
Sayfa yükleniyor...
Sayfa yükleniyor...
Sayfa yükleniyor...
Sayfa yükleniyor...
Sayfa yükleniyor...
Sayfa yükleniyor...
Sayfa yükleniyor...
Sayfa yükleniyor...
Sayfa yükleniyor...
Sayfa yükleniyor...
Sayfa yükleniyor...
Sayfa yükleniyor...
Sayfa yükleniyor...
Sayfa yükleniyor...
Sayfa yükleniyor...
Sayfa yükleniyor...
Sayfa yükleniyor...
Sayfa yükleniyor...
Sayfa yükleniyor...
Sayfa yükleniyor...
Sayfa yükleniyor...
Sayfa yükleniyor...
Sayfa yükleniyor...
Sayfa yükleniyor...
Sayfa yükleniyor...
Sayfa yükleniyor...
Sayfa yükleniyor...
Sayfa yükleniyor...
Sayfa yükleniyor...
Sayfa yükleniyor...
Sayfa yükleniyor...
Sayfa yükleniyor...
Sayfa yükleniyor...
Sayfa yükleniyor...
Sayfa yükleniyor...
Sayfa yükleniyor...
Sayfa yükleniyor...
Sayfa yükleniyor...
Sayfa yükleniyor...
Sayfa yükleniyor...
Sayfa yükleniyor...
Sayfa yükleniyor...
Sayfa yükleniyor...
Sayfa yükleniyor...
Sayfa yükleniyor...
Sayfa yükleniyor...
Sayfa yükleniyor...
Sayfa yükleniyor...
Sayfa yükleniyor...
Sayfa yükleniyor...
Sayfa yükleniyor...
Sayfa yükleniyor...
Sayfa yükleniyor...
Sayfa yükleniyor...
Sayfa yükleniyor...
Sayfa yükleniyor...
Sayfa yükleniyor...
Sayfa yükleniyor...
Sayfa yükleniyor...
Sayfa yükleniyor...
Sayfa yükleniyor...
Sayfa yükleniyor...
Sayfa yükleniyor...
Sayfa yükleniyor...
Sayfa yükleniyor...
Sayfa yükleniyor...
Sayfa yükleniyor...
Sayfa yükleniyor...
Sayfa yükleniyor...
Sayfa yükleniyor...
Sayfa yükleniyor...
Sayfa yükleniyor...
Sayfa yükleniyor...
Sayfa yükleniyor...
Sayfa yükleniyor...
Sayfa yükleniyor...
Sayfa yükleniyor...
Sayfa yükleniyor...
Sayfa yükleniyor...
Sayfa yükleniyor...
Sayfa yükleniyor...
Sayfa yükleniyor...
Sayfa yükleniyor...
Sayfa yükleniyor...
-
 1
1
-
 2
2
-
 3
3
-
 4
4
-
 5
5
-
 6
6
-
 7
7
-
 8
8
-
 9
9
-
 10
10
-
 11
11
-
 12
12
-
 13
13
-
 14
14
-
 15
15
-
 16
16
-
 17
17
-
 18
18
-
 19
19
-
 20
20
-
 21
21
-
 22
22
-
 23
23
-
 24
24
-
 25
25
-
 26
26
-
 27
27
-
 28
28
-
 29
29
-
 30
30
-
 31
31
-
 32
32
-
 33
33
-
 34
34
-
 35
35
-
 36
36
-
 37
37
-
 38
38
-
 39
39
-
 40
40
-
 41
41
-
 42
42
-
 43
43
-
 44
44
-
 45
45
-
 46
46
-
 47
47
-
 48
48
-
 49
49
-
 50
50
-
 51
51
-
 52
52
-
 53
53
-
 54
54
-
 55
55
-
 56
56
-
 57
57
-
 58
58
-
 59
59
-
 60
60
-
 61
61
-
 62
62
-
 63
63
-
 64
64
-
 65
65
-
 66
66
-
 67
67
-
 68
68
-
 69
69
-
 70
70
-
 71
71
-
 72
72
-
 73
73
-
 74
74
-
 75
75
-
 76
76
-
 77
77
-
 78
78
-
 79
79
-
 80
80
-
 81
81
-
 82
82
-
 83
83
-
 84
84
-
 85
85
-
 86
86
-
 87
87
-
 88
88
-
 89
89
-
 90
90
-
 91
91
-
 92
92
-
 93
93
-
 94
94
-
 95
95
-
 96
96
-
 97
97
-
 98
98
-
 99
99
-
 100
100
-
 101
101
-
 102
102
-
 103
103
-
 104
104
-
 105
105
-
 106
106
-
 107
107
-
 108
108
-
 109
109
-
 110
110
-
 111
111
-
 112
112
-
 113
113
-
 114
114
-
 115
115
-
 116
116
-
 117
117
-
 118
118
-
 119
119
-
 120
120
-
 121
121
-
 122
122


diğer dillerde
- español: Hach ORBISPHERE 3655 Manual de usuario
- français: Hach ORBISPHERE 3655 Manuel utilisateur
- Deutsch: Hach ORBISPHERE 3655 Benutzerhandbuch
- English: Hach ORBISPHERE 3655 User manual
- русский: Hach ORBISPHERE 3655 Руководство пользователя
İlgili makaleler
-
 Hach Polymetron 9582sc Basic User Manual
-
 Hach ORBISPHERE 31 series Basic User Manual
-
 Hach 51 Series Kullanım kılavuzu
-
 Hach Lange ORBISPHERE 3100 Basic User Manual
-
 Hach Lange ORBISPHERE 3100 Basic User Manual
-
 Hach ORBISPHERE 510 Basic User Manual
-
 Hach polymetron 9240 Basic User Manual
-
 Hach ORBISPHERE K-M1100 Basic User Manual
-
 Hach ORBISPHERE 410 Basic User Manual
-
 Hach ORBISPHERE 6110 Kullanım kılavuzu